

The UK is experiencing record temperatures for this time of year, and a new government report warns that the country’s infrastructure is not built to withstand the Mediterranean-style heat that is becoming increasingly common. These changes are already affecting daily life in the country. People are struggling to sleep during hot nights, power grids are under pressure from increased use of air conditioning and fans, and the heat waves are disrupting travel, work, and even some outdoor activities.
At the same time, there are signs that unusual warming in the Pacific is underway. This will heighten the effects of climate events globally later this year because of the size of the Ocean.
Forecasts suggest El Niño (the warm phase of the El Niño–Southern Oscillation (ENSO) in the Pacific Ocean) is set to return this year, raising global temperatures and disrupting weather patterns worldwide. Its effects could start as soon as June and last through the winter, possibly into early next year. This means its impact will be strongest in the second half of this year and could continue into 2027, adding to the warming we are already seeing and increasing the challenges for the economy and people.
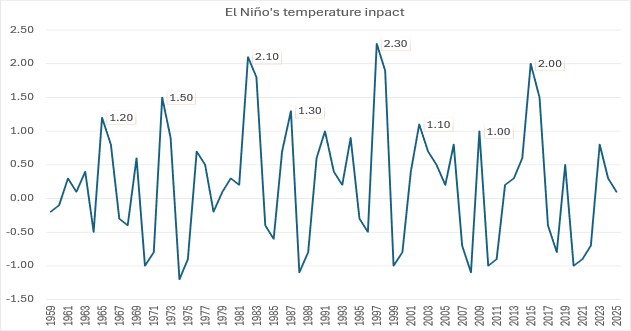
Historical evidence since 1959 shows that every major El Niño has cut global GDP, with very strong events in 1982–83, 1997–98, and 2015–16 causing losses equivalent to a mid‑sized recession. La Niña, its cool counterpart, delivers only modest and short‑lived gains, leaving El Niño’s negative impact dominant.
In short, climate and weather events are likely to have a big impact on policy this year, influencing everything from energy security to food prices and financial markets. The effects are so wide-ranging that this is the first post in a three-part series examining how the expected El Niño event could affect the global economy, financial markets, and the UK.
El Niño: the global impact of weather patterns in the Pacific
By way of explanation, El Niño occurs when the usual rise of cold water in the eastern Pacific weakens, allowing warm water to move east across the ocean. Normally, this ‘upwelling ‘ of cold water helps keep surface sea temperatures lower in the Pacific. When it slows down, surface temperatures rise quickly in the central and eastern Pacific.
At the same time, places like Australia and Indonesia, which are usually warmer, get drier and have more unstable weather. Moreover, this shift in ocean heat alters global air circulation, raises global temperatures, and disrupts weather patterns worldwide.
Signs are that the Pacific Ocean is warming quickly and point to an upcoming El Niño, which occurs every 2-7 years and could last up to 18 months. Heat is building below the surface, trade winds are getting weaker, and the US’s NOAA (National Oceanic and Atmospheric Administration) now puts the chance of El Niño forming by mid-summer at 61%, with a 25% chance it will be ‘very strong.’ For policymakers, markets, and households, the main worry is the potential economic impact and whether the world is prepared for another climate shock.
The analysis starts with a brief history: data on El Niño events since 1959 show a clear, worrying pattern that has often gone unnoticed, see chart 2. Looking at every El Niño event over the last sixty years –when records have been reliable – shows a pattern in how these events affect global GDP.
Each significant warming of the El Niño has resulted in a measurable reduction in global output:
- Weak events trim around 0.1%.
- Moderate events deepen losses to 0.2-0.3%.
- Strong events push the impact toward 0.4-0.5%.
- Very strong events such as those in 1982-83, 1997-98, and 2015-16 have caused the biggest economic shocks.
El Niño therefore has a global economic impact that affects agriculture, energy, insurance, infrastructure, labour productivity, and trade. History shows that El Niño can alter rainfall, temperatures, and storm patterns across many continents simultaneously because of the sheer size of the Pacific Ocean that gives birth to it.
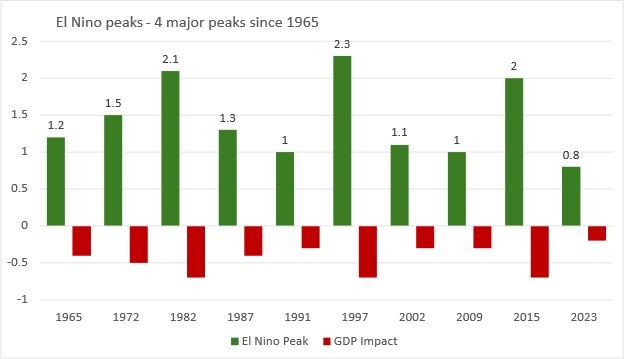
The economic losses from El Niño are not symmetrical, i.e., balanced out by gains during La Niña periods, when sea temperatures are cooled by upwelling of water from the South Pacific. El Niño’s negative effects on global GDP are larger and longer lasting. This is clear from the historical data, see the chart.
Why does the historical evidence matter now? Three structural differences separate the coming El Niño event from its predecessors:
- Record ocean heat content
- More interconnected global supply chains
- Higher urban and asset exposure
Therefore, even if the 2026 El Niño is as strong as past events, the economic impact could be worse.
Three possible paths for the global economy
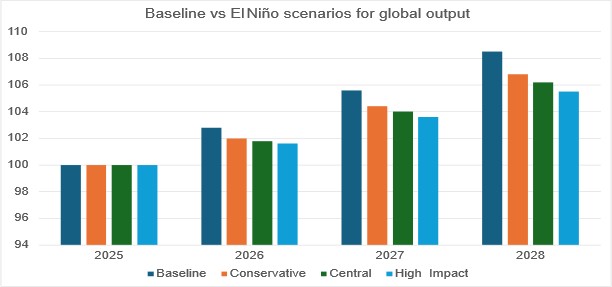
Chart 3 shows three possible paths for global output. The baseline scenario assumes no El Niño and that global GDP increases steadily through 2028. In contrast, the three El Niño scenarios illustrate how even a moderate climate shock can slow growth, while a very strong event can result in persistent economic losses.
- The Conservative scenario (-0.8%) reflects a strong but not extreme event.
- The Central scenario (-1.0%) aligns with NOAA’s probability of a very strong event.
- The high-impact scenario (-1.2%) represents a super El Niño amplified by today’s warmer oceans.
The data show that El Niño has long-term effects. Even after temperatures return to normal, crop losses, damaged infrastructure, supply chain problems, and lower productivity from heat continue to hold back output.
This is the defining macroeconomic feature of climate shocks:
they leave the world poorer than it would otherwise have been.
How El Niño hits the real economy
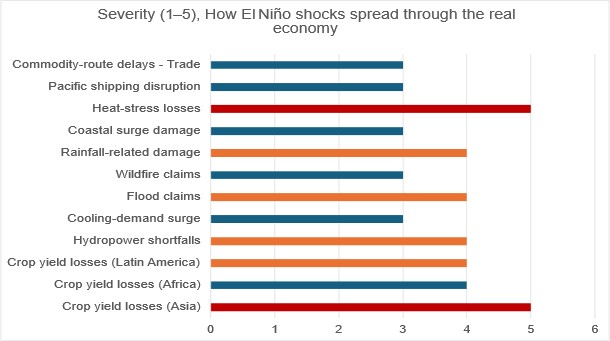
The mechanism is well understood and visible in every major event in chart 4.
- Agriculture suffers from simultaneous crop stress across Asia, Africa and Latin America.
- Energy systems face hydropower shortfalls and higher cooling demand.
- Insurance markets absorb elevated claims from floods, storms and wildfires.
- Extreme rainfall, coastal surges and landslides damage infrastructure.
- Labour productivity falls as heat stress rises in tropical and subtropical economies.
- Trade and logistics are slow as Pacific shipping routes face disruption.
Each of these impacts makes the others worse, leading to a global GDP shock instead of just a regional one. This disruption can last for years because fixing infrastructure, recovering crops, and restoring supply chains takes a long time.
The macroeconomic takeaways
- The historical data show that every major El Niño since 1959 has delivered a negative GDP shock.
- The most severe events have caused global losses equivalent to a mid-sized recession.
- The physical precursors to a very strong event are now visible in the Pacific.
- For central banks, treasuries, and investors, El Niño is a significant economic risk that is still not fully priced in; otherwise, it wouldn’t be such a shock each time it occurs.
- For portfolio managers and risk officers, missing this risk could mean lost chances to hedge, adjust investments, or rethink prices in climate-sensitive sectors. Spotting these hidden risks early lets decision makers act before markets react suddenly.
- The global economy is entering a period in which climate variability and climate change are no longer distinct phenomena. Their interaction now has a large economic impact.
Conclusion
As the Pacific Ocean continues to warm and the risk of a very strong El Niño rises, it’s increasingly likely that this warming will have major economic effects worldwide. History shows that El Niño always cuts global output, and today’s conditions – warmer oceans, tighter supply chains, and more exposed assets – mean the next event could be even worse. Climate variability and climate change now work together to increase risk. As a result, it is important to acknowledge this and prepare across a range of areas – economic, market, policy and health.
Governments must look at all the policy options across the services that they provide and the infrastructure risks that may arise from climate change. Financial professionals should check whether their portfolios are sensitive to climate change, plan for severe El Niño impacts, and review exposures in climate-vulnerable sectors. Acting now can help mitigate the risks that will shape the global economy in the year ahead. We should now accept that Climate-driven shocks are a part of the global economy, and so are the increasing costs that everyone faces.