
Ahead of the March 15 Budget, some of the most important data released in February are worth reviewing to gain insight into what flexibility and room for policy manoeuvre the Chancellor may or may not have available.
These are price inflation, wage inflation, economic growth, public sector borrowing figures and money supply. The essential news from the price inflation figures is that it’s fallen for three consecutive months. Although the headline figure remained above 10% in January 2023, it’s clear that further falls – and sharp ones at that – in the second half of the year are virtually baked into the cake.
Why is this? Well, it’s because the early indicators of that outcome, such as oil prices, gas prices, producer prices, the opening of global supply chains as China reverses its COVID lockdown policy, and the fall in container ship prices, are all suggesting that price inflation will continue to decline through the year and into 2024. Indeed, Bank of England forecasts suggest that price inflation will dip to an annual rate of 1% sometime in the middle of next year, see chart 1.

Wage growth in the UK accelerated from October to December 22 to a 5.9% annual rate, the highest since the pandemic. On the surface, it doesn’t look good for future price inflation because it suggests that workers are getting pay rises to compensate for the increase in price inflation. However, that would be to misunderstand the dynamics of what drives wage inflation, which is ultimately productivity or the ability of firms to make profits and pay some of that surplus to employees because of their contribution.
If one looks at pay adjusted for changes in price inflation, wage growth is not keeping pace with prices because, as the chart below shows, real pay growth is declining. That implies that wage inflation should not be the primary concern in driving price inflation, but wage deflation because it will lead to weaker economic growth. If you like, it’s contributing to a fall in the standard of living and, therefore, to demand across the economy.
Official data using the consumer price index to adjust wages shows that from October to December, real total pay fell by 4.3%, the largest fall since February to April 2009, when it fell by 4.5%.

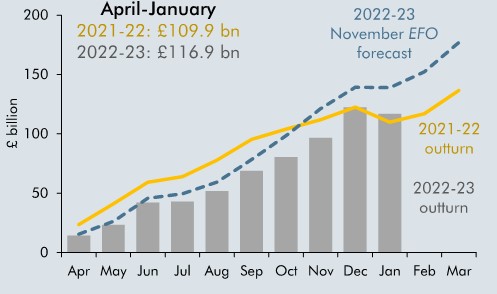
Considering the impact of falling real pay, it is unsurprising that the economy remained weak in the last quarter of 2022 with no growth. But in the previous quarter, growth had fallen by 0.2%, so the economy contracted by 0.1% on average in the last six months. Indeed, as the Office for Budget Responsibility (OBR) pointed out in November last year, the UK economy is still smaller than before the pandemic started, the only G7 economy in this position. What will be interesting in the week ahead is to what extent the OBR changes the Economic forecasts it made in November 2022, see chart 3.

One spot of good news, however, is that the slowdown in growth, looking at chart 3, is better than expected. Or to be more precise, not as bad as forecasts made four months ago.
That has translated into the public sector finances also being better than expected.
In January, the public sector’s net borrowing recorded a surplus of 5.4 billion, much better than the OBR had expected. Of course, it should be remembered that January is always a big month for tax receipts with self-assessment payments due.
But better-than-expected economic growth, high inflation, which boosted VAT receipts, and less spending on the energy support scheme, owing to lower gas prices and the milder-than-expected winter, all contributed to the surplus.
So, the question is, what will this mean for the direction of fiscal policy with the government having an extra 30 billion or so net to play with compared with the forecasts made in November last year? That is anybody’s guess, of course. What is clear is that there are many demands:
- Care homes
- Hospitals
- Helping those affected by the cost-of-living crisis
- Extending the energy price cap
- Increasing infrastructure investment
- Increasing defence spending
- Saving some for tax cuts ahead of elections.
In short, the pressures to find extra money to spend on a host of areas, all of which have merit, will make the chancellor’s job very difficult.

The UK’s latest money supply figures released on March 1 show that the ability for inflation to be generated in the economy has been severely reduced over the past year. From a peak of 15.4% in February 2021, UK’s broad money supply growth is only 3.7%. That implies the economy is not generating inflation. It also means that, with continued quantitative tightening (QT) – the withdrawal of liquidity from financial markets by purchasing government debt held by the private sector – we can expect even weaker growth in M4, which could turn negative in 2024 if the authorities continue QT.
What does this mean for interest rates? The chart shows that financial markets still expect interest rates to rise by another 50 to 75 basis points or by ¾% of a percentage point. Long-term interest rates have stalled at around 4%, some 3% above levels before the Russian invasion of Ukraine. There is a significant chance that rates do not have to rise from current levels and that cuts will be more aggressive and arrive earlier than expected in 2024.
