
With inflation continuing to rise and central banks reacting by raising interest rates, the critical question must be how high will rates have to rise to curb inflationary pressure? To do that, we need to consider what a ‘neutral’ interest rate – one that kept prices steady – would look like, and how much higher the current rate would need to be than that neutral rate to cool consumer price inflation? Today of course, the Bank of England raised interest rates once again, cutting inflation pressures.
On the flipside, of course, hiking interest rates will inevitably lead to slower growth as it would lower demand, easing upward pressure on prices and helping to create conditions where further price hikes aren’t accepted by consumers – who would cut back on spending – or attempted by producers who know that they cannot pass it on. As it is, few would argue that inflation will subside without weaker economic growth.
Further interest hikes are now inevitable
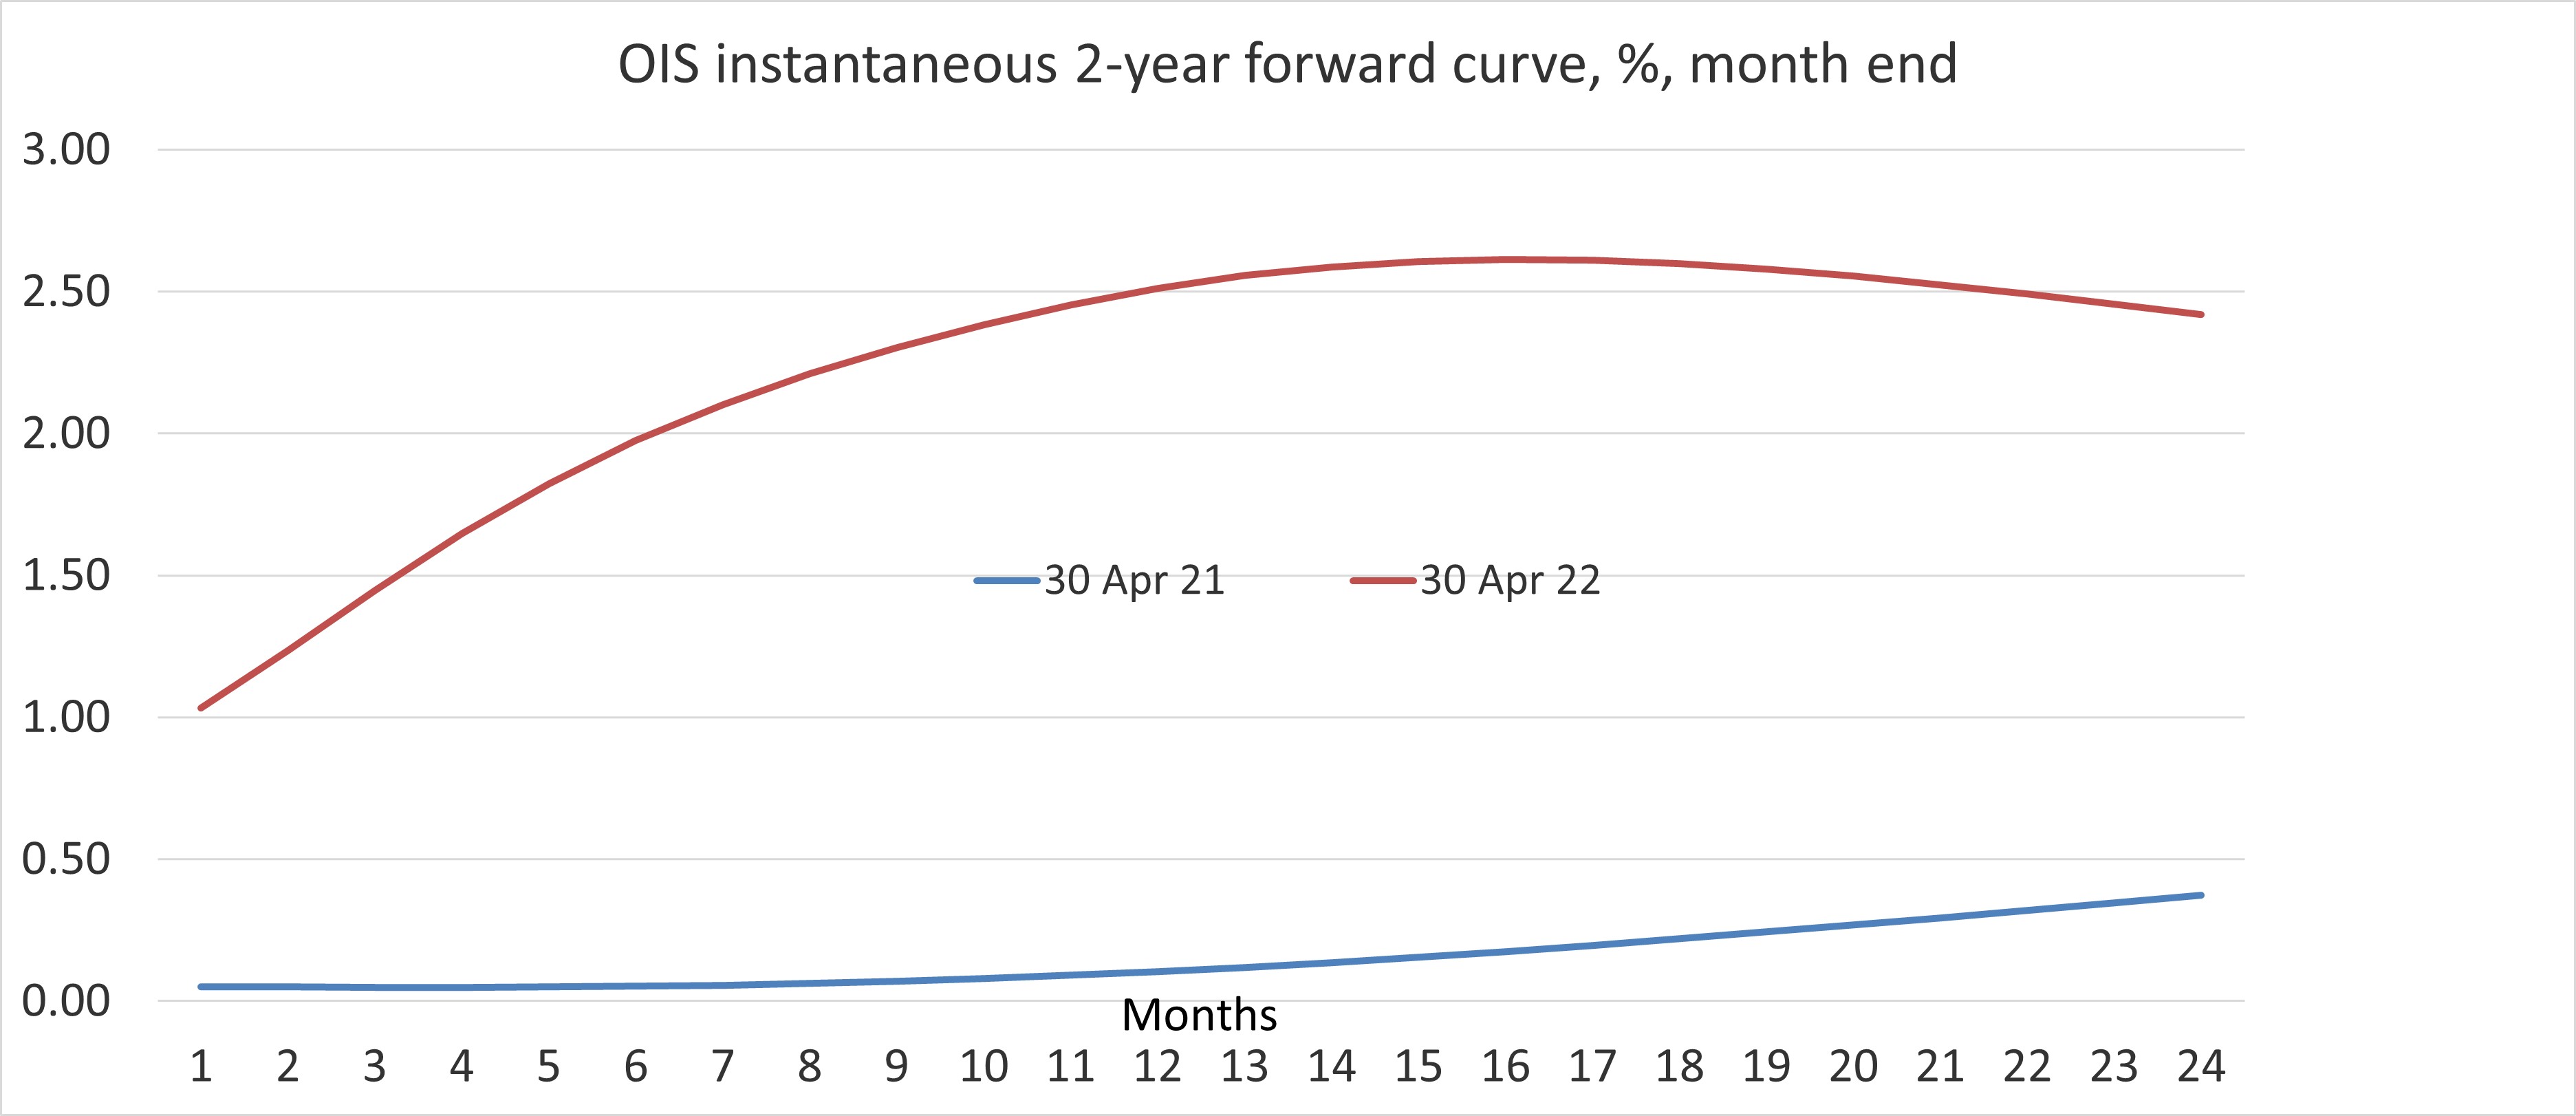
Chart 1 shows that financial market expectations for interest rates in the months ahead are sharply higher than a year ago. At the end of April 2021, financial markets expected the Bank rate to be 0.1% in 12 months, i.e., April 2022, compared to the actual outcome of 1%. The current 12-month year ahead view in these same markets is that the Bank rate will be 2.6% in a year – namely, by the end of April 2023.
Interestingly, inflation expectations from the yield curve suggest that market participants don’t think inflation will permanently increase. Inflation expectations peak at the 10-year rate at around 2½% and then drop back to around 1½% per cent at the 40-year interval. That leaves real interest rates – nominal rates adjusted for price inflation – still in negative territory even two years out, and then increasingly negative beyond that point.
Money supply growth has been too fast, for too long
The inflationary pressure we’re currently seeing is driven by the too fast growth of money supply relative to economic activity that we’ve seen in the last few years, which we can see clearly in chart 2. If growth in money supply is consistently above price inflation, it encourages excessive liquidity and demand, leading to a buildup of inflation pressure as too much money chases too few goods and services. Monetary expansion usually impacts an economy with a lag, and employment and output perhaps with a one-to-two-year lag. The lag between a change in the direction of M4 money growth and price inflation is between two and three years, although both are variable.
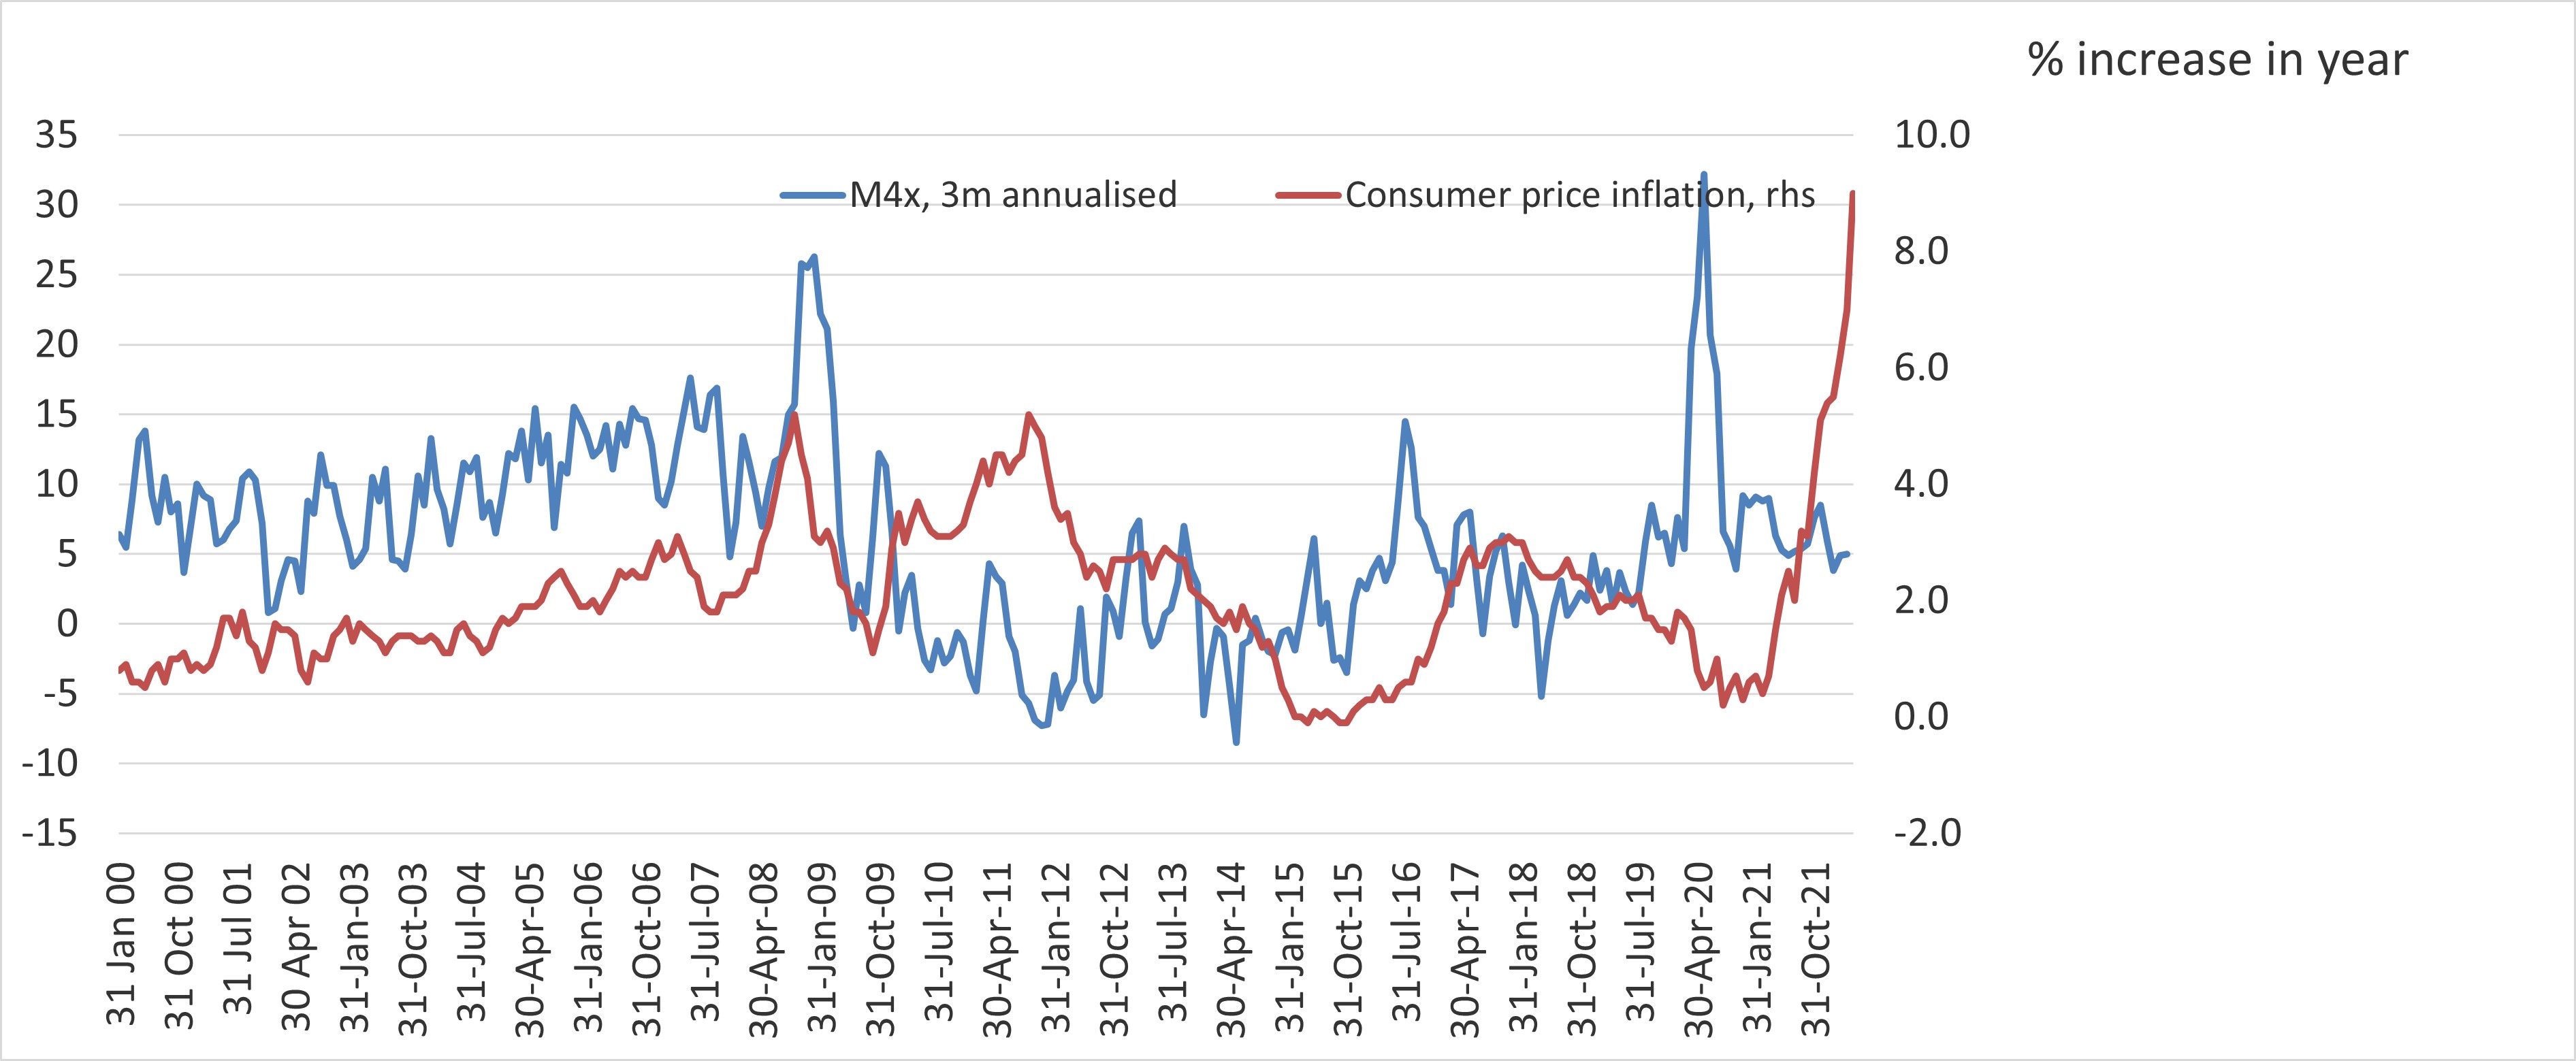
There was a sharp surge in money supply in 2008/9 because of the injection of liquidity to protect financial markets from a market meltdown. This led to higher consumer price inflation in 2011, peaking at just over 5%. However, a sharp economic slowdown, an appropriate increase in QE and cuts in interest contributed to relatively slow and stable growth in M4 growth between 2010 to 2019, so persistent inflation pressure failed to emerge in that period.
A modest surge in money supply in 2016 had led to a similarly modest rise in price inflation a year after that because the economy once again remained weak. The problem occurred when the Pandemic struck because money supply growth surged to over 30% on a 3-month annualised basis due to sharply lower interest rates and another significant increase in quantitative easing. That inevitably boosted the money stock, the effects of which we’re starting to see.
Is there a ‘right’ level for interest rates?
Are there ways of inferring the correct level of interest rates? There is no one answer, but there are a couple of key measures to help estimate how high-interest rates will have to rise for the UK’s central banks’ policy stance to be leaning against price rises. The Taylor rule and nominal interest rates relative to money GDP growth are shown in chart 3 and chart 4, respectively.
The ‘Taylor’ rule suggests higher rates
The Taylor rule is formula for calculating the central bank interest rate based on an inflation target, which also accounts for the deviation of economic growth from its long-term average. If inflation is higher than target and growth is above trend, this formula shows what level rates should be to bear down on price and hence wage inflation. Of course, the opposite is true; it shows how low rates should go when inflation and growth are falling relative to their trend. It suggests that the peak in interest rates could be 3.75%. It also indicates that interest rates have been too low for too long, suggesting that they should have been raised by the end of 2016 to a peak of around 2% before easing in 2018 in response to slower economic growth. What the Taylor rate implies is that official rates were too low before the Pandemic struck, that no cuts were necessary, and that rates should have been raised before the end of 2020.

Nominal GDP growth suggests higher rates.
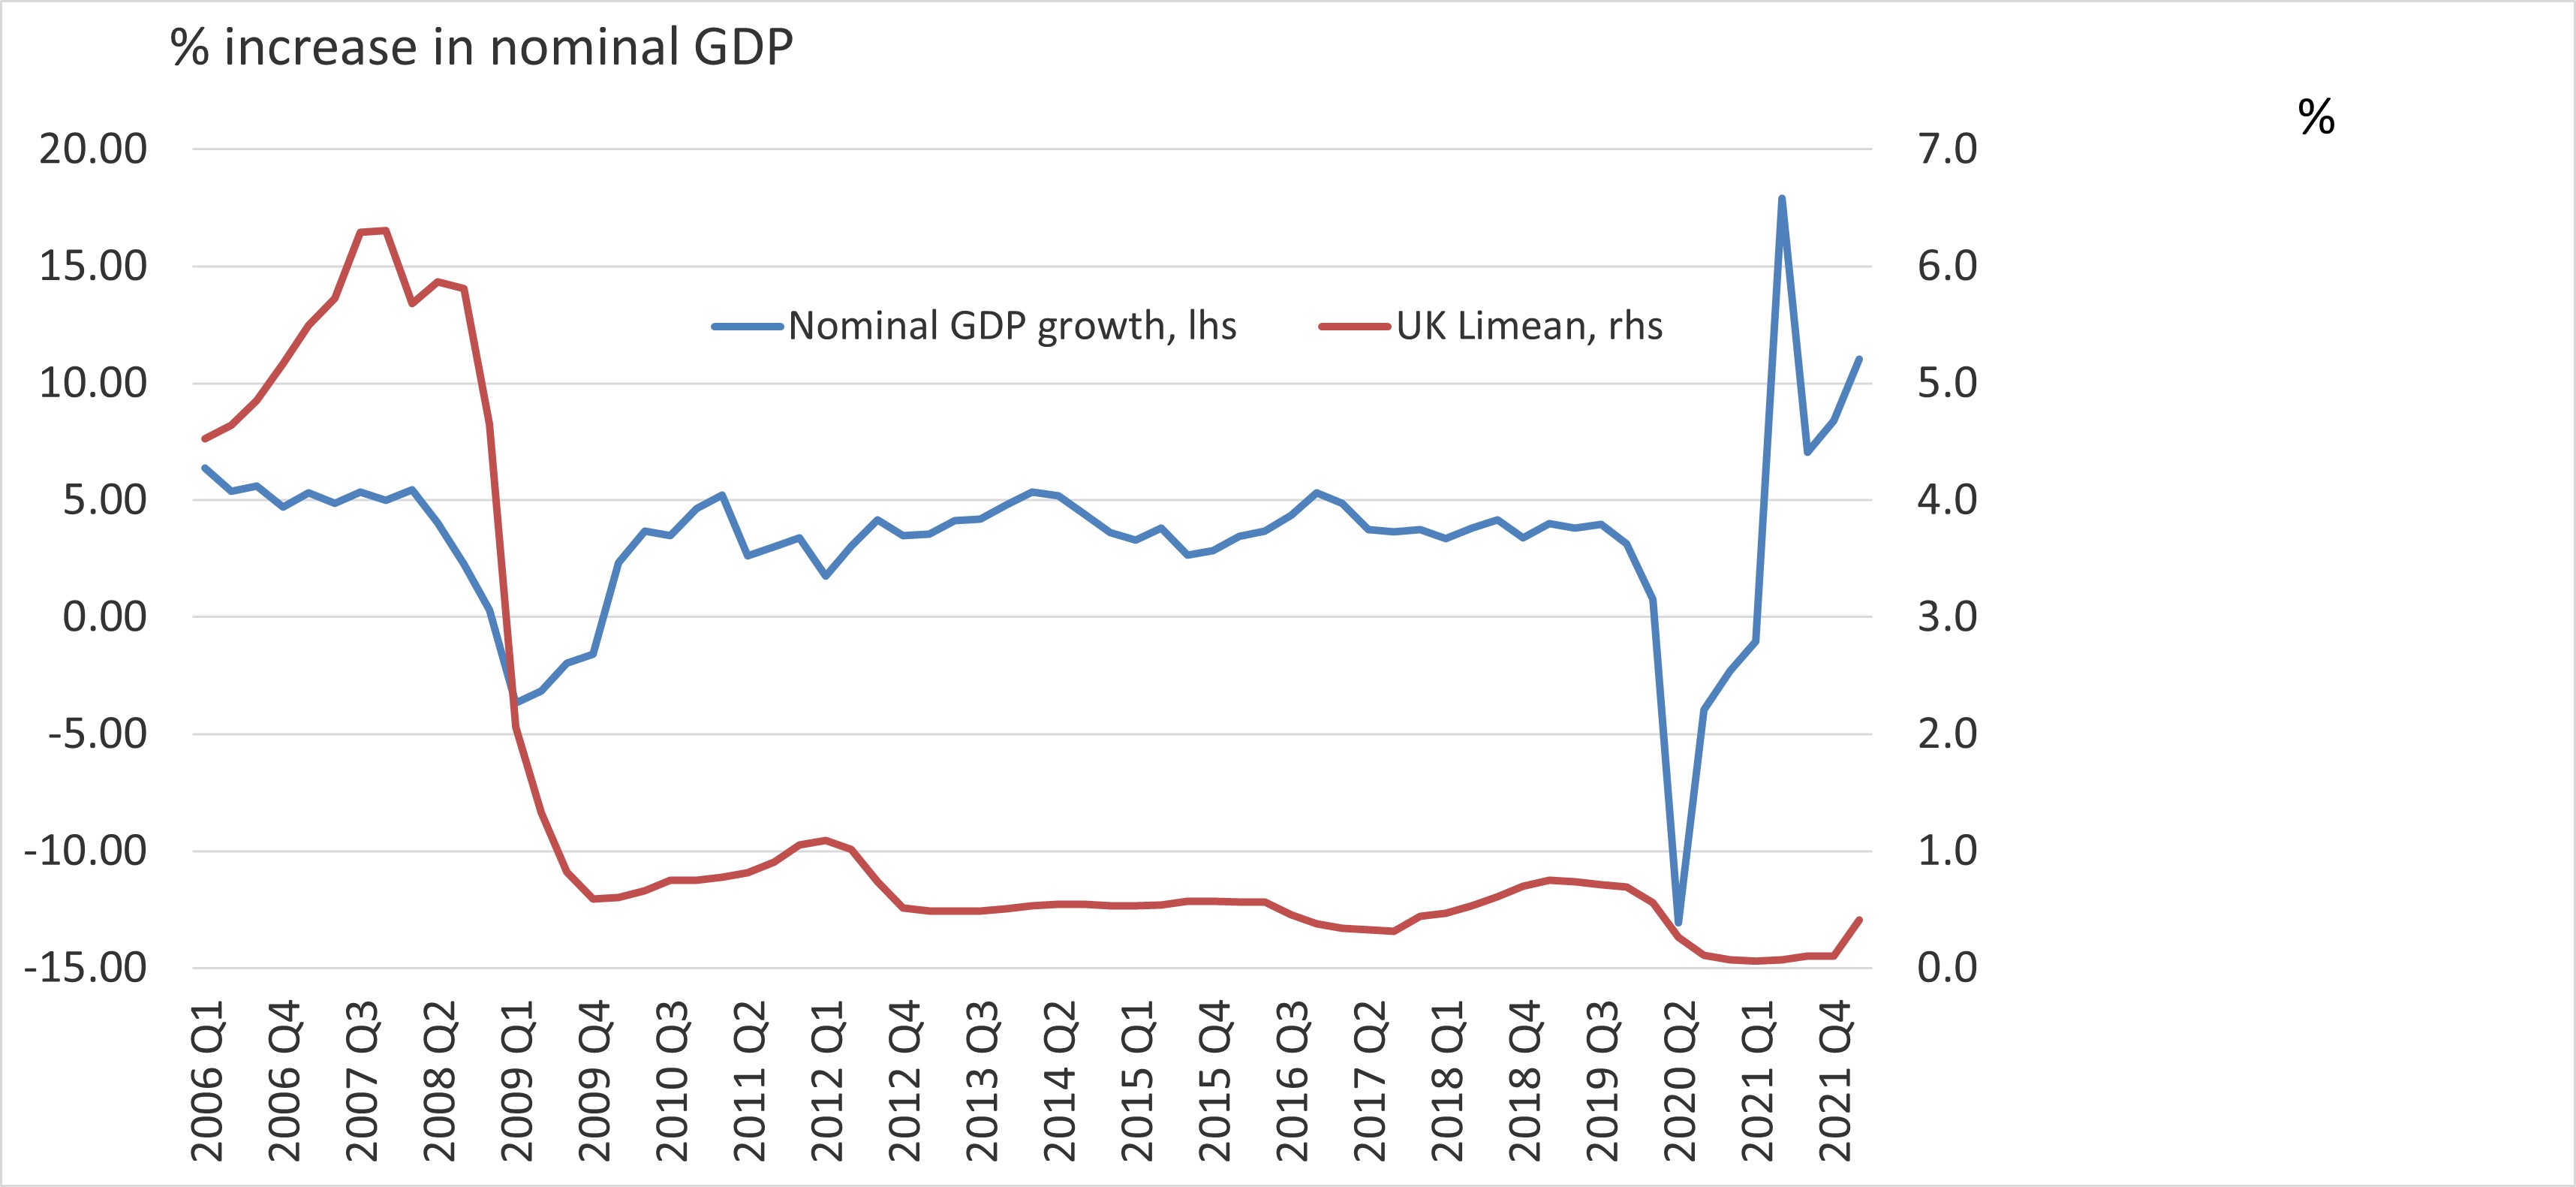
The second measure is whether short term policy interest rates are above or below nominal GDP growth – a combination of volume growth (i.e., inflation-adjusted expansion in output) and economy-wide inflation. If interest rates are above this measure of economic growth, then inflation and output are being squeezed by a higher cost of borrowing than economy-wide investment returns suggest. This, therefore, reins in both the demand for loans and the pace of economic activity. As with Taylor, this approach shows (in Chart 4) that the official interest rate has been low for too long. It suggests that this has been the case since 2010. Only at the height of the Pandemic in 2020 were they appropriate. This approach indicates a rise to around 5% in the Bank rate. Of course, these two approaches should be more indicative of trends than actual forecasts, but they can be valuable guides.
Initial inflation spikes as a consequence of Pandemic and war
However, we shouldn’t downplay the fact that the initial cause of the inflation crisis we are currently experiencing is supply side issues created by the Pandemic, which raised prices. Global shutdowns also hampered supply and, as the worldwide economy reopened, supply lines opened slower than demand, leading to higher prices.
Unfortunately, the war in Ukraine is adding further impetus to higher prices, reducing supply of food stuffs and raw materials, with sanctions against Russia driving energy prices higher.
The role of central banks
Central bank monetary policy did not create these conditions, nor can it solve them. The only solution to supply-side problems is supply-side responses.
Nonetheless, monetary policy does have a role to play. If it had been relatively tight when these crises unfolded, the inflation pressure surge would have been more muted and easier to control. Any sustained increase in inflation requires an increase in the money supply. Therefore, if official monetary policy is leaning against this increase in money supply, it is less likely to have persistent inflation resulting from any one-off price inflation shock.
The good news is that with money supply growth already slowing rapidly, as shown in chart 2 above, a continuation of the current high level of price inflation is highly unlikely. Indeed, one risk implied by this indicator is that if monetary policy were to overtighten and money supply growth became negative, economic growth could easily slip into negative territory. Finding the balance to maintain price and rate stability will be crucial to ensure economic growth.