
In June this year, annual UK consumer price inflation on the central banks preferred measure (CPIH) hit 2.4%, marginally above the 2% target and the highest level since the pandemic started in 2019. It was a rate last seen in August 2018. For some commentators, it was a vindication of the view that the Bank of England’s policy is far too loose for current economic conditions.
With the Bank of England now anticipating inflation to peak at 4% this year before declining to hit its inflation target of 2% in two years, the rise was enough to boost speculation that the UK Monetary Policy Committee should raise interest rates at its next meeting in early August. In the event, there was a unanimous decision to keep rates at 0.1%. But a policy change was announced: to cease reinvesting maturing bonds when the bank rate reached 0.5% and reverse QE once it got to 1%.
Over in the US, meanwhile, price inflation hit 5.4% in June, although the central bank there played it down. Therefore, it seems that after acting decisively amid the pandemic to loosen interest rates, and with recovery seemingly underway, there are signs that some central banks around the world are now considering whether or not to tighten monetary policy.
Reviewing the long-term pattern
A brief review of UK price inflation since the last downturn in 2008/9 might be instructive about the tendency of inflation not to continue to accelerate, see chart A.
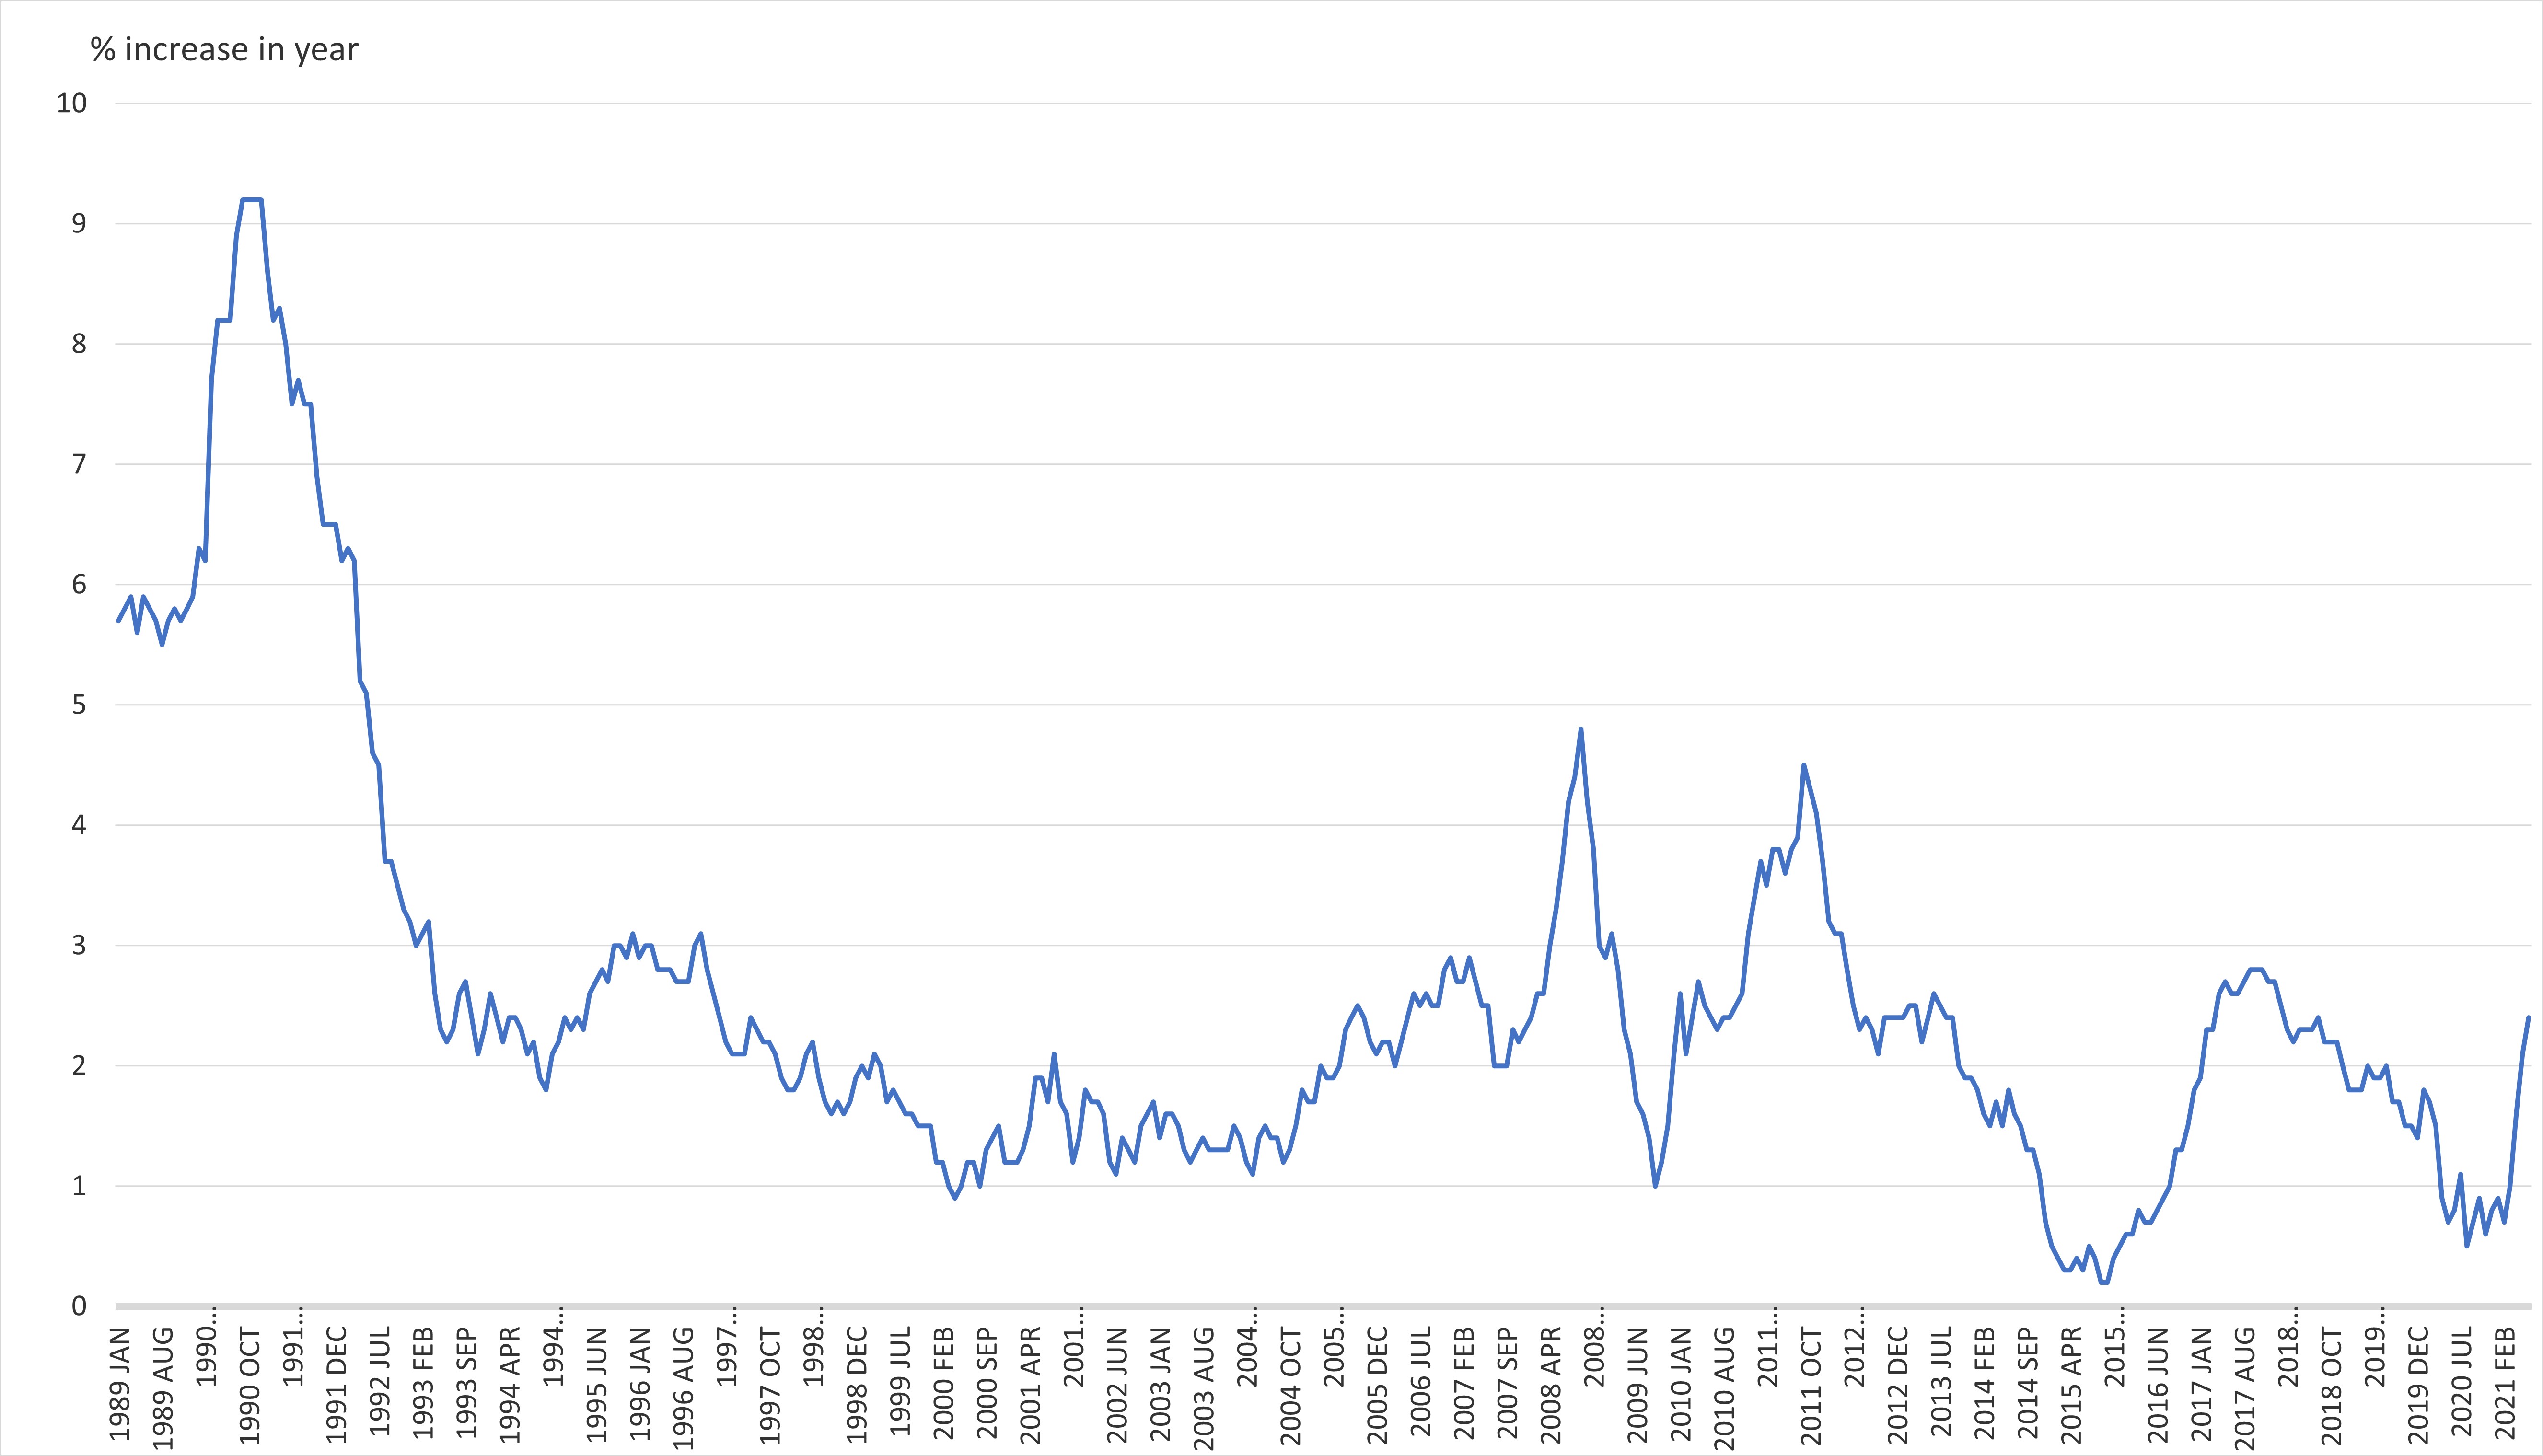
UK inflation on the CPIH measure peaked at 4.5% in September 2011 after the 2008 / 9 Financial Crisis, following a low of 1% in September 2009. Since the September 2011 peak, annual consumer inflation fell back to just 0.3% in June 2015. It then took another three years to record a height of 2.4% in August 2018. However, from that point, annual consumer inflation reversed, to end 2019 at just 1.4%. With the pandemic taking hold as we entered 2020, the rate declined to only 0.6% in November of last year. True, it has since risen to 2.4% in June this year, but the long-term pattern of staying low is clear.
We need to ask ourselves: what has changed so quickly in the last few months to lead us to believe that inflation is on the kind of upward trajectory that will break the pattern that we’ve seen over the previous 32 years? After all, this current crisis is not yet over. Concern about a possible winter wave of infections remains. The UK economy has not yet regained its previous peak. The recovery in some parts of the country and some sectors has barely got underway.
Signs to watch
Although showing significant pickup, the world economy also shows signs that the recovery is not consistent across different economies and could be undone by another Covid-19 induced lockdown in the autumn. Finally, the recent lockdown is just ending. So, there are plenty of reasons for concern that economic growth may slow.
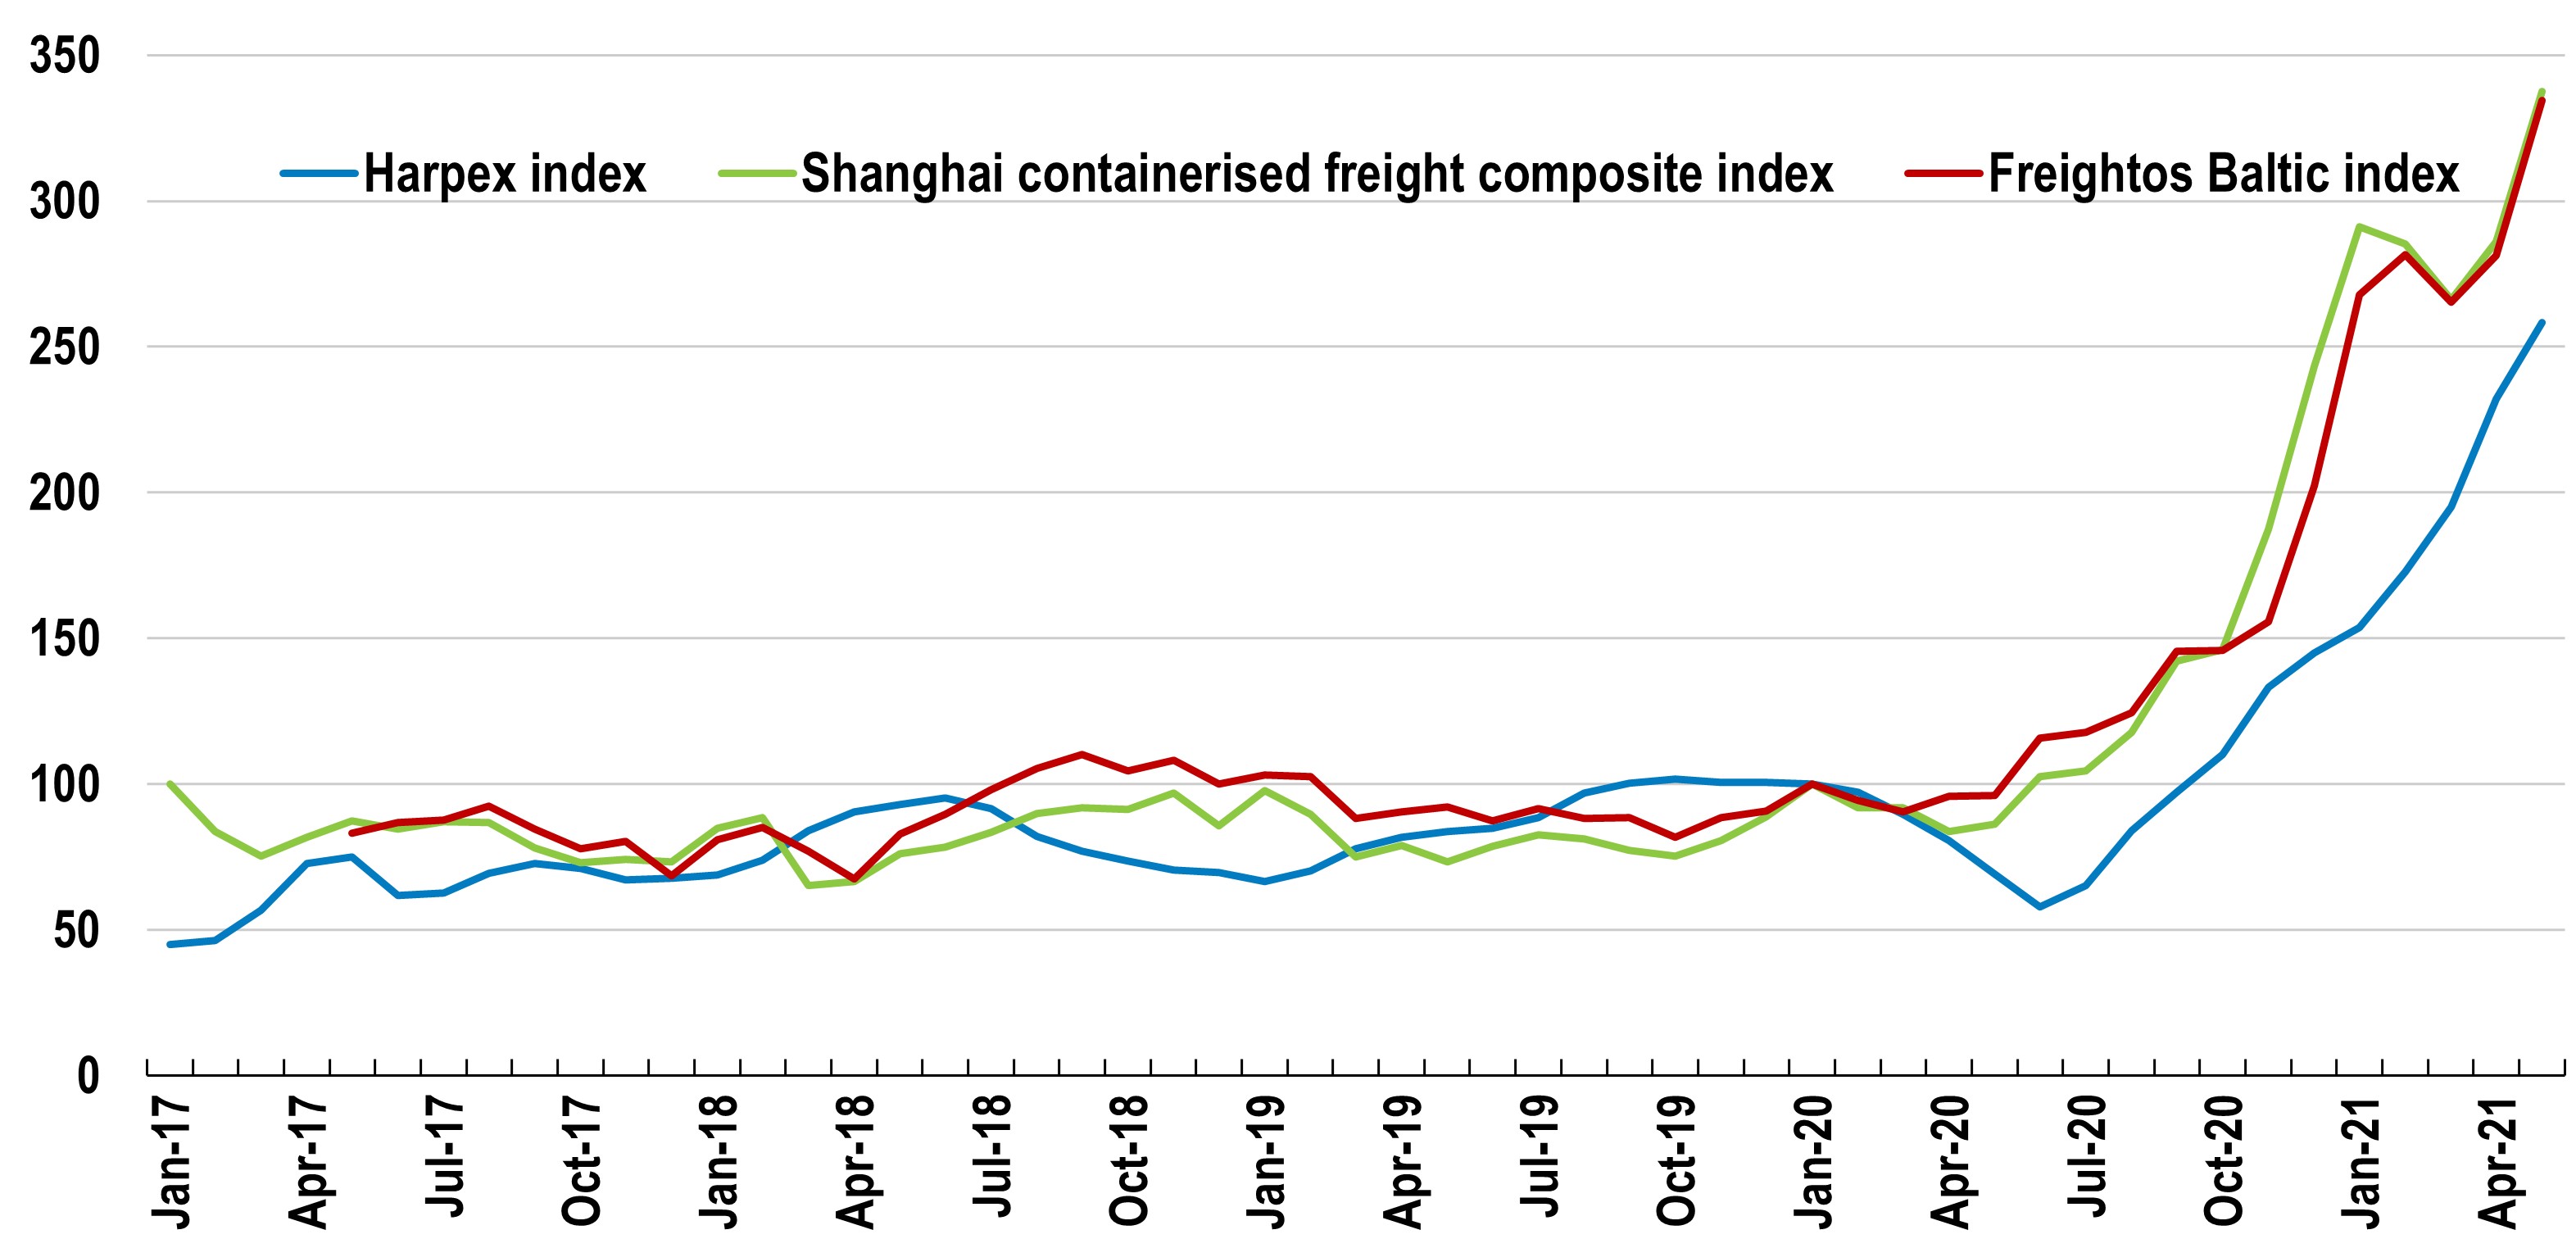
Yet, there are also signs that inflation has turned, that policymakers should not ignore. Shipping costs have risen sharply, as chart B shows. Compared with January 2020, the average increase in these three measures of shipping goods between countries is well over 300%. At the same time, oil prices have jumped. Metals prices have leapt. Food prices are increasing sharply, and computer chips – used in the software of a range of other modern conveniences, like cars – are in such short supply that it’s led to the closure of production lines.
So, there are reasons to think that supply chains may be damaged or, at the very least, not fully recovered from the effects of the pandemic. Global merchandise trade, for example, is recovering but still weak. Container port traffic was up 12.2% in March versus the year before, and air freight was up 4.4%. Therefore, upward pressure on global prices may become a deep-seated and systemic issue.
That said, global economic forecasts suggest that many countries – even by the end of next year – will still have lower output levels than before this current crisis started. That hardly seems the recipe for an outbreak of global inflation.
Response or trend?
There are many one-off reasons why prices have risen in the UK but few long-term reasons. For example, a look at the monthly profile shows that price inflation this year is higher simply because previous figures were so weak. Therefore, the annual rate is picking up this year. In addition, energy prices (oil and gas) are higher, so import prices are up, feeding into firms’ input prices and consequently, their output prices.
Although seemingly high, wage inflation is not worrying – according to the Office for National Statistics – because its sectoral composition is pushing it up artificially. The reason: those less likely to be unemployed are in the higher paid sectors less affected by the pandemic. Those in lower-paid sectors are, therefore, most affected by the pandemic. That creates an upward skew in the average earnings figures.
In reality, therefore, this is not a sign of wage inflation and indeed not a sign that it will remain persistent. For instance, there are still nearly 2 million people that are furloughed. Although the unemployment rate is just 4.8%, it is still likely to go up rather than down. There is no sign of a wage-price spiral that would be a harbinger of a longer-lasting inflation episode. The underlying pace of annual growth in the six quarters since the pandemic started is estimated at 2¾%.
Money supply expectations
For some, rising overall money supply growth has been a source of concern because of its impact on the stability of long-term inflation. But money growth has recently been slowing reasonably consistently. It remains, however, too high to be consistent with low price inflation over a 3-to-5-year period. Still, recent monthly figures have shown a slowdown in the annual rate to below 5% growth on a broad measure called M4, see chart C.
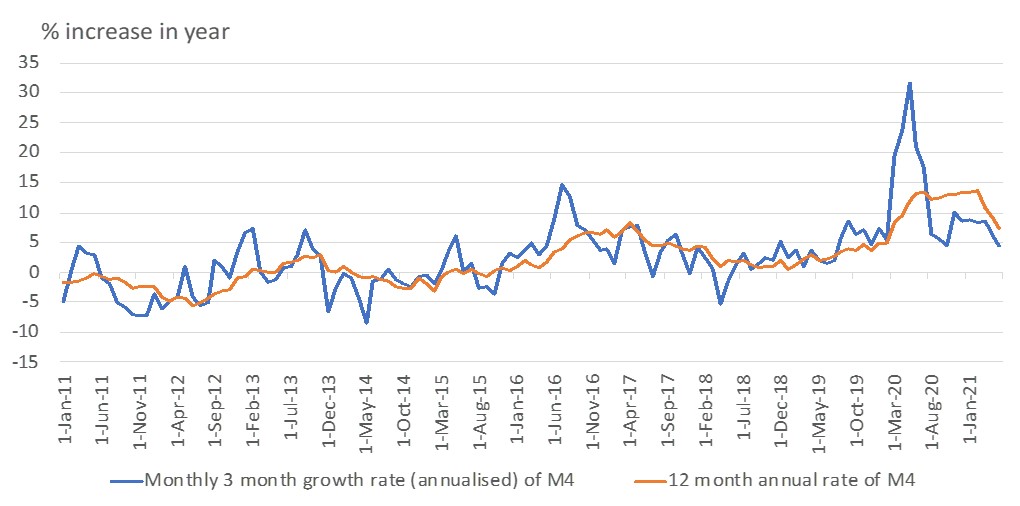
At this pace, monetary growth is more consistent with a 2-3% annual GDP growth rate than the expectation of 7% this year and 6% in 2022. August’s economic forecast from the MPC shows that, from 2023, UK economic growth slows to 1¼% or so per annum, implying that M4 growth will slow further. Such a growth rate is consistent with the low inflation era of the last 30 years rather than the previous high inflation period. On this basis, low interest rates are also likely to persist, albeit not at the recent near zero level.
That said, as the UK continues to tiptoe away from the pandemic driven recession, monetary policymakers will be very cautious, looking for risks on both sides of the inflation dial.